Recently finished reading, and thought I’d be worth logging it here, to ensure I don’t forget:
Amazing read when it comes to the words and sentence structures used (I assume that’s only true when read in its original form, with reasonable Swiss German language understanding), but Jeremias Gotthelf (https://en.wikipedia.org/wiki/Jeremias_Gotthelf) really likes to philosophize (and sermonize), which makes the whole read much less enjoyable.
Wanted to generate a gif to create a rotational view of an object for a different project. Thought I’d document here how easy this is:
#1 take lots of pictures of the object, while rotating it slowly
#2 In gimp, File > Open as Layers
#3 In gimp, Save as… filename.gif (check the ‘animation’ checkbox)
I’ve quickly done this again (without much image optimization) with my gold plated Gundam MSN-06S SINANJU (a project I’ll write later about 🙂 here’s the result:
rotating gold plated gundam gif made with gimp – this was done quickly, so the y axis positioning is far from perfect – but you get the point 🙂
What an epic book. Just finished https://en.wikipedia.org/wiki/Anna_Karenina – and am quite impressed. It’s challenging to capture the impression, but I seem to most like the holistic storytelling. Long, but totally worth the read, also because it takes the reader back into a time long ago in Russia.
Looks like raspberry has come quite a long way. headless (no monitor/screen, no keyboard, no mouse) and wireless (no ethernet/wired connection) setups are as easy as creating a wpa_supplicant.conf with your network settings:
Seen as a guide to various health and fitness related aspects to dive deeper into, I think the book does a reasonable job. – There are a couple of things I hadn’t heard about before (and a couple which are so far out of my horizon, I don’t think I’d ever have learned about them, if it weren’t for the book (baseball..)) providing a reasonable increase in knowledge spectrum.
Ah, how awesome. Looking forward to see these land in Switzerland. Would love to try one out. (Uncertain about the exterior design, but it certainly has the potential to turn into a classic 🙂 #LibertyElectriCityMobility
The findings shared have been transformational for my worldview, and how I navigate the world today. If you need to kill some time, I recommend to at least watch the TED talks – after which the book is a bit of a repeat and you could skip to Chapter 11 right away.
I have a bunch of friends over at swisstopo and I always considered them artists – little did I know about the true level of artistry that goes into their beautiful maps:
That one contains 468 usable startLongitude/startLatitude elements, which fits nicely into kml as Placemark and renders well on https://www.google.com/mymaps.
The resulting map:
all my Garmin activities anchored in a location, plotted on a map using kml Pacemarks
Which also works well zooming in:
zoomed in view of all my Garmin activities in a specific region
Again, drop me a note if you feel I could help you with any of this.
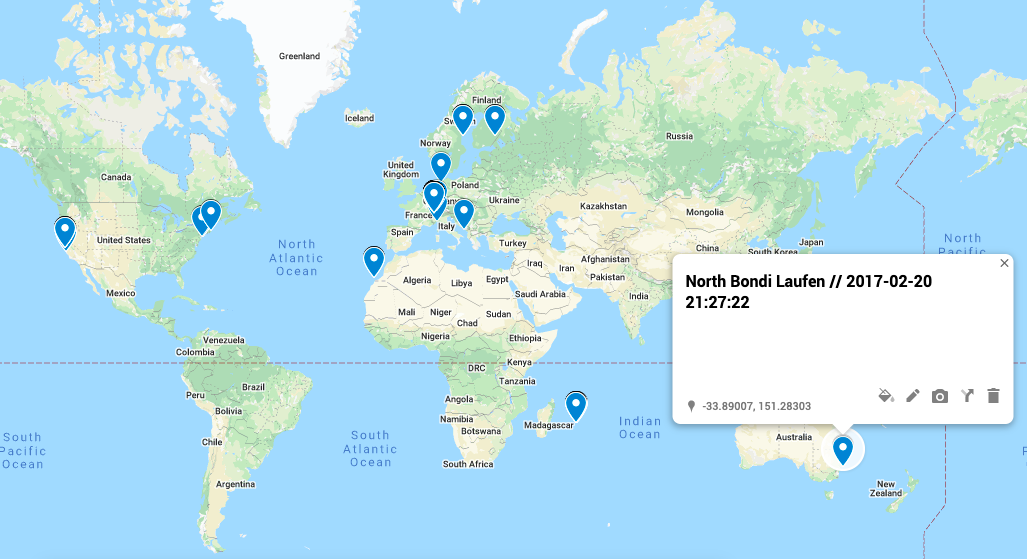
everywhere in this world I’ve run, biked, hiked, skied, swum
Today I had some fun exporting all my recorded Garmin tracks and plotting them as a heatmap on Google Maps.
After having wanted to create a map like this for ages, I finally found some time to hack together the toolchain needed. If you want to do the same, the easiest way I’ve found was:
Alternatively, drop me a line, and I’d be happy to help 🙂
You might wonder how to plot all your tracks on a map – which is what I initially started with. However, with 346 recorded activities, using kml to plot them (through various platforms) I found it difficult to navigate the result. – If you’d like to get your fit files converted to kml to play around with them, also drop me a note, I have a converter for that too.
A close up view (without adjusting radius, maxIntensity,.. so not optimal):